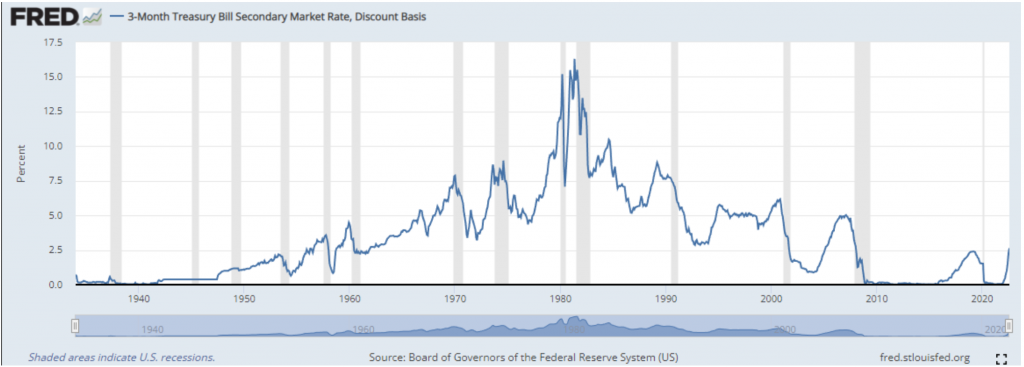
Over these past two decades there has been much discussion about how we are continually entering into a new normal. This year, however, we are back to the “old normal”, at least as far as financial markets are concerned. We are back to a place where one can earn money on their savings accounts. The below chart shows the historical 90-day Treasury Bill yields, which are often similar to overall money market yields. I recall when both of these yields were in the 5% range, when I began my career in financial advisory services in Santa Barbara over the Summer of 1995. Currently, Treasury Bills are paying over 3%. Money market yields are also on the rise.
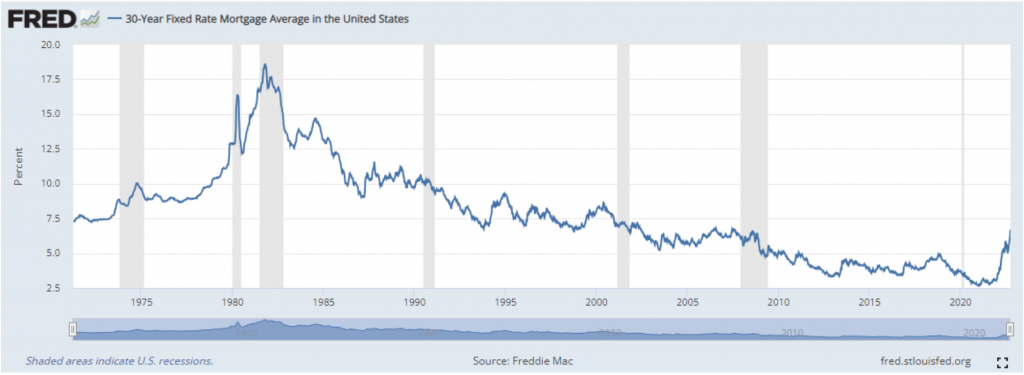
We are now in a place where it costs money to borrow money, which is unfortunate for new- home buyers, but ultimately helpful in thwarting excessive risk-tasking. Reasonable interest rates are part of a healthy economy. Below is the chart of historical 30-year fixed mortgage rates, which shows our current 6.7% rate getting close to the long-run average of 7.38%.
And we’re in the place of another Bear Market in the global equities markets, which tends to normally happen about every three years.
Getting back to this place of the “old normal” has proven to be a very painful process, with not only global equities falling around 25% year-to-date, but conventional “safe” bonds falling about 15%. A 60/40 portfolio (i.e., 60% stocks and 40% bonds) is down about 20% year-to-date. After inflation, the drop is roughly 24% vs. the median (average) drop since 1900 of 22%. The
median time to reach a peak (once the markets hit bottom) is about 13 months with a total return of 29%. The chart below shows all drops of greater than 10% after-inflation of a 60/40 portfolio since 1900:
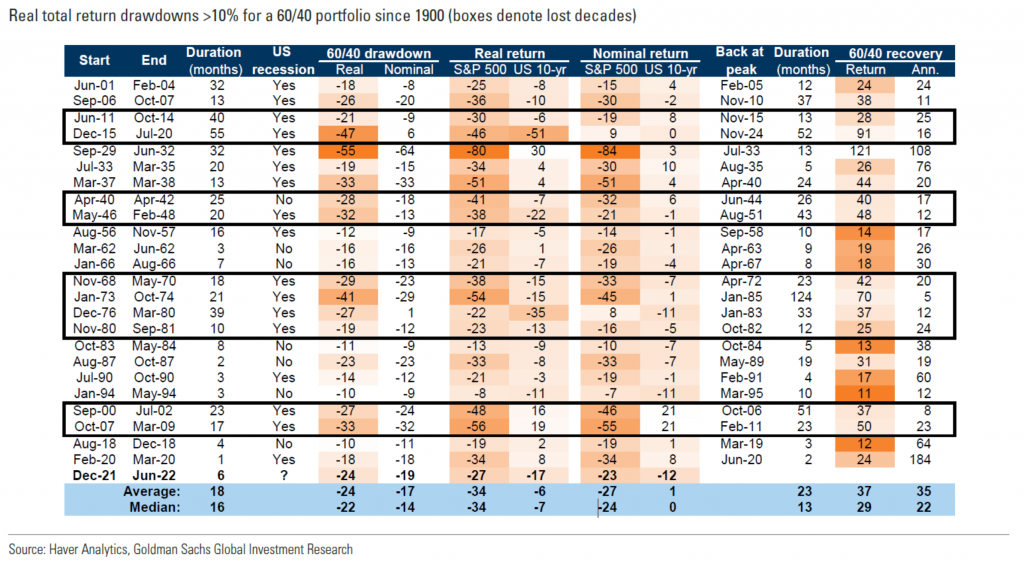
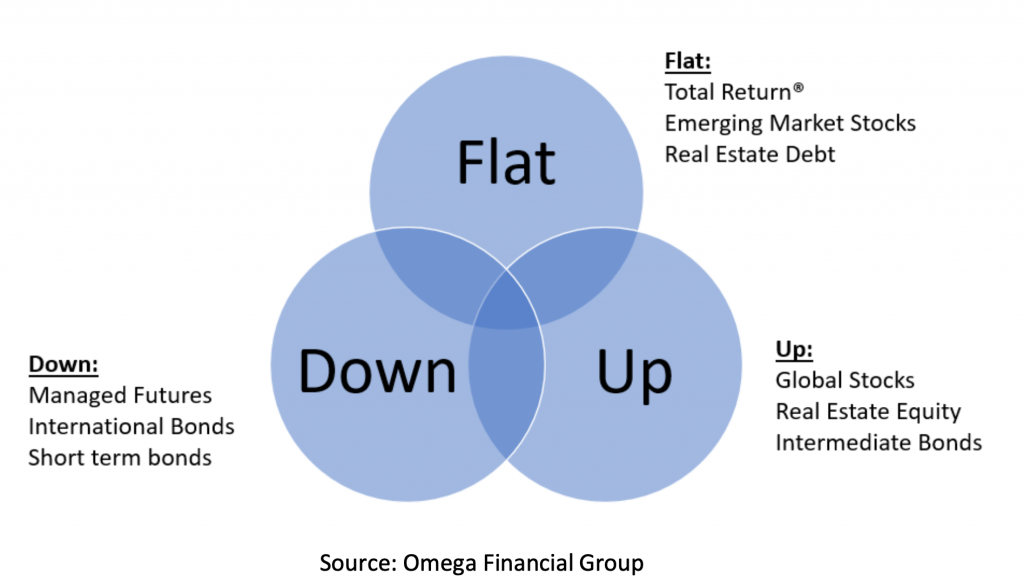
The chart reminds us that we can predict the stock market for sure: we know that for any future point you want to predict, the stock market will be up, down, or flat. It’s hard to think of any other option. The typical individual investor often only has investments that tend to do well (poorly) when the stock market goes up (down). For example, global stocks, real estate equity, and intermediate bonds tend to move in the same direction, as we have seen this year. However, there are other investments like Managed Futures, for example, that do better when stocks go down. Indeed, this has been our best investment slice this year, growing over 25%, while stocks fell some 25%. Thus, while a typical portfolio has fallen along with conventional assets, some of the assets in the portfolio are actually profitable. This dynamic helps limit the impact of taking funds out of a portfolio during significant market falls, as we can take from those asset slices that are faring materially better than global stocks. Private investments are another area of investment that have fared considerably better than global stocks and bonds this year.
To illustrate how our approach can help during difficult times, consider the Global Financial Crisis of 2008. At that time, stocks fell a whopping 50%. If one was only investing in “Up” assets while taking distributions, this would not have worked out very well. In addition, before this period there was September 11th and another difficult economic time. In fact, the entire first decade of the 21st century was a difficult time for US equities.
For simplicity, here we assume one invests her $10 million in the S&P 500 and takes annual withdrawals of $500,000, growing at roughly 3% per annum. The below chart shows what would have happened if she started this plan in August of 2000, the beginning of a decade of volatile equity returns that ended back at where they started value-wise (i.e., US equites had no net return after over 10 years). As can be seen, the investor would have totally exhausted her $10 million portfolio by 11/2013.
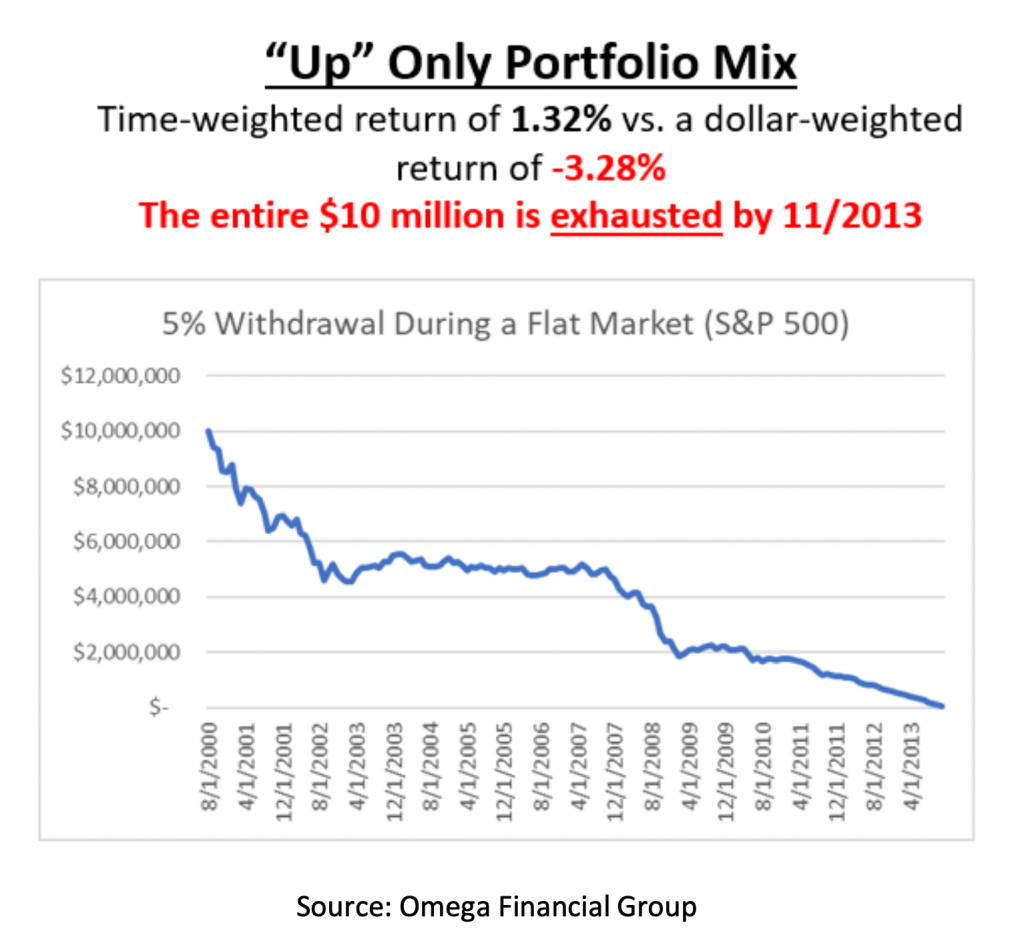
While the actual investment (i.e., the S&P 500) had a 1.32% annualized return, the portfolio experienced a loss of 3.28% per annum because when stocks fell in value, more had to be sold at lower prices. This means the investor had a return of about 4% less per year than the actual investments she was investing in!
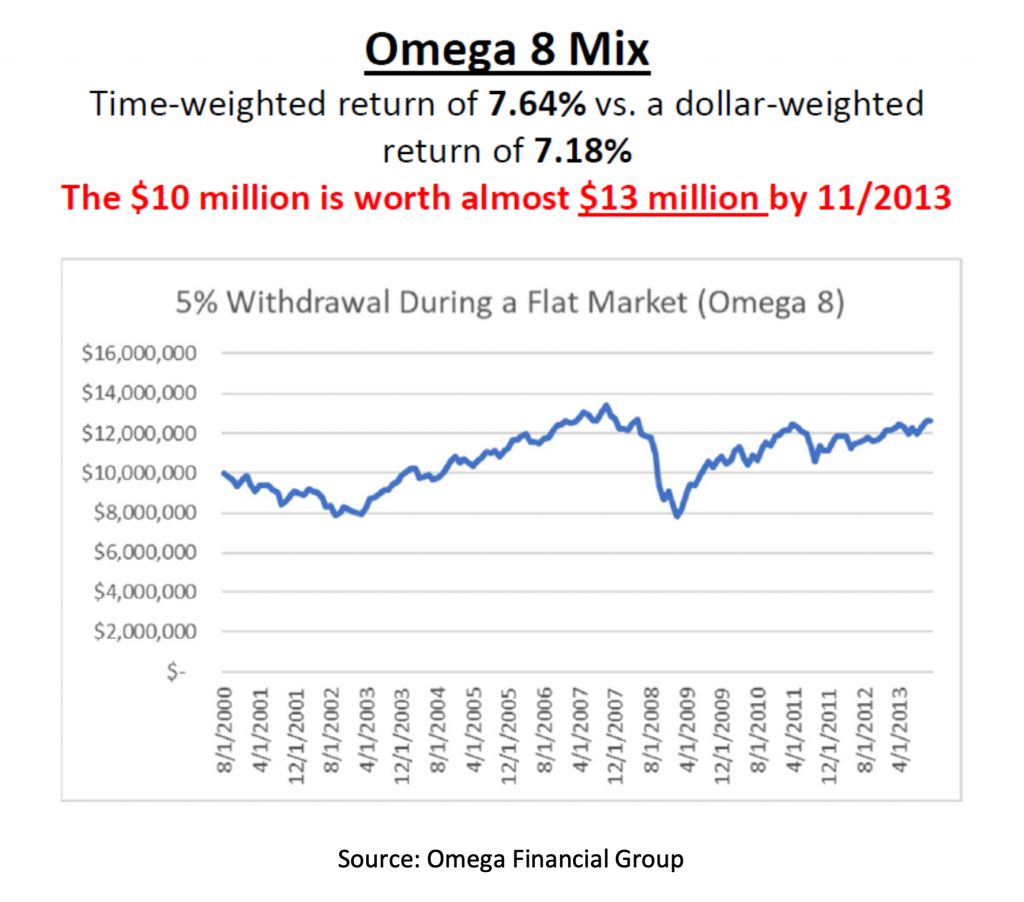
In contrast, an Omega 8 portfolio1, would not only have supported the $500,000 growing distributions over those years, but would also have grown in value to about $13 million, as shown in the below chart. However, note at the depths of the financial crisis the low value point would have been about $8 million, or 20% less than the original investment. Interestingly, the investment return, was about 7.64%, whereas the investor return was about 7.18%; very little return was lost due to having to sell during volatile times. That is, have different States of the World investments helped limit the impact of taking money out during significant markets, even when the overall portfolio was down in value.
Thus, we were assuming that the “old normal” would return some day, with the States of the World approach (we just didn’t know when). That is, we have already positioned your portfolio for sustaining distributions during market sell-offs. In addition, we are doing five more things to help your financial situation.
First, we are removing our long-only commodities exposure while maintaining and growing our managed futures exposure. We added some long-only commodities in anticipation of inflation, which has helped. However, now that recession fears loom large, we are counting on managed futures to provide a better hedge. Indeed, at least historically, the best returns from managed futures are during higher inflationary periods, even while inflationary pressures recede. The below chart summarizes these values.
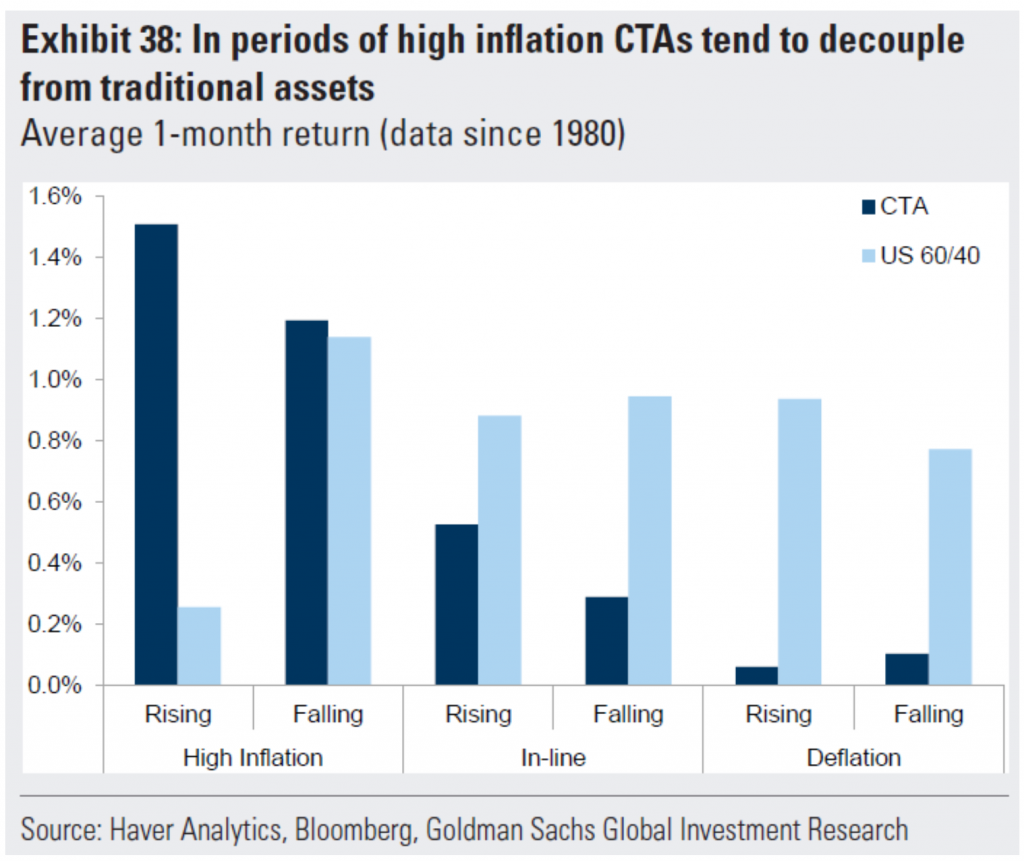
As can be seen, during high inflationary periods, managed futures (i.e., CTAs) have averaged 1.2% to 1.5% per month return.
Second, we are continuing to add private investments, where appropriate. This is also something that has been helping during times like these. For example, whereas conventional credit (i.e., bonds) are down a whopping 15% (including income) for the year, our private credit funds are up about 2-3%.
Third, we are converting government-only international bonds into including corporate international bonds. This allows us to tax harvest, as well as better position for global economic normalization, when it comes.
Fourth, we have been taking advantage of rising interest rates to earn an attractive return on our cash assets. In fact, we have been using a variety of strategies, depending on a particular client’s needs and goals.
Fifth, we are strategically harvesting tax losses, where sensible. That is, we are working on effectively building up a tax offset reservoir we can use against future realized gains.
Despite what we have done and are currently doing, we know times like these are not fun, even painful. However, I hope that you can rest in the confidence that we are working diligently not just with your investments, but also your overall financial strategy to best prepare for recovery. We look forward to providing you a personal update on these matters at our next review visit. Of course, should you like to connect before then, please, as always, do not hesitate to reach out to us, as we are here to serve you. In the meantime, we hope you can find joy in family, friends, and adventure. Just like the “old normal”, we will recover.
- Please note past performance is not necessarily indicative of future performance. These charts and examples are for educational purposes only and not a promise of future investment returns.


