![1st Quarter 2019: “Easy Go, Easy Come” [sic]](https://www.omegafingroup.com/wp-content/uploads/2019/07/OMEGA-HEADER.jpg)
1st Quarter 2019: “Easy Go, Easy Come” [sic]

Dylan B. Minor PhD, MS, CFP®, ChFC, CLU, Chief Strategist and CEO
Stock investments had a dreadful 4th quarter in 2018; most markets entered a bear market (i.e., a fall of 20% or more from peak to trough). What were we all thinking and feeling on Christmas Eve, around the time markets were bottoming out? Well, hopefully, you were thinking about which pie you’d eat or which glass of wine you’d drink at a lovely holiday dinner. But for those of you that had an eye on the financial markets, it probably didn’t feel that great. Indeed, some say it was the worst Christmas Eve on record, in terms of the financial markets. And what was to happen the next quarter? Not what our feelings would have predicted (if we’re all honest with each other). In fact, in the next quarter, this 1st quarter in 2019, we witnessed the strongest start in financial markets in some 20 years! In what seemed like a blink of an eye strategically allocated portfolios had already recovered in their value, and then some.
In terms of global stock markets, this is what the past two quarters looked like:
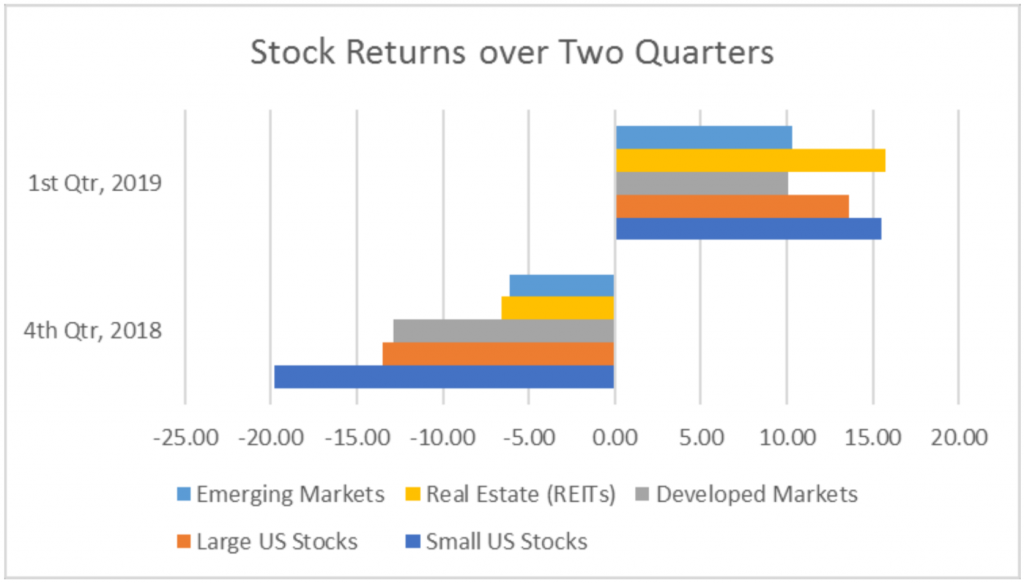
Source: Morningstar and Author Calculations
In general, the harder a market fell in the 4th quarter of 2018, the higher it bounced in the 1st quarter of 2019. Of course, there are always exceptions; otherwise, we could simply predict these things. For example, Real Estate was almost tied for the least falling asset in the 4th quarter: falling less than 7%, less than half of what many stock markets fell. However, it was the highest returning stock asset class for the 1st quarter 2019. In sum, all the stock markets experienced an easy go, easy come over these past two quarters.
What happened in the bond markets during these past two quarters? Here, we saw a similar pattern. However, the most conservative bond markets had positive returns over both periods, as reported in the chart below:
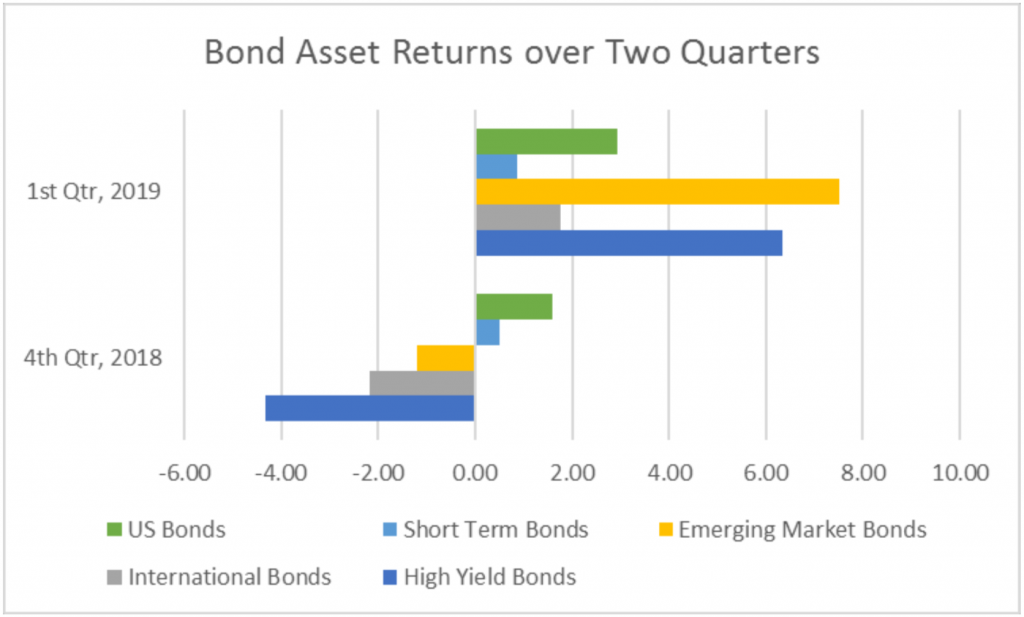
Source: Morningstar and Author Calculations
Similar to REITs, the most recent quarter’s highest returning bond market, Emerging Market bonds, was far from the worst market in the 4th quarter.
So what were most investors doing during these past two quarters? Just the opposite of what markets were doing! That is, investors on whole were easy go, easy (or eventually) come.
Here is a chart showing net investor money flows (i.e., denoted by the grey line), both for ETFs (i.e., exchange traded funds) and mutual funds, for US (i.e., Domestic) funds:
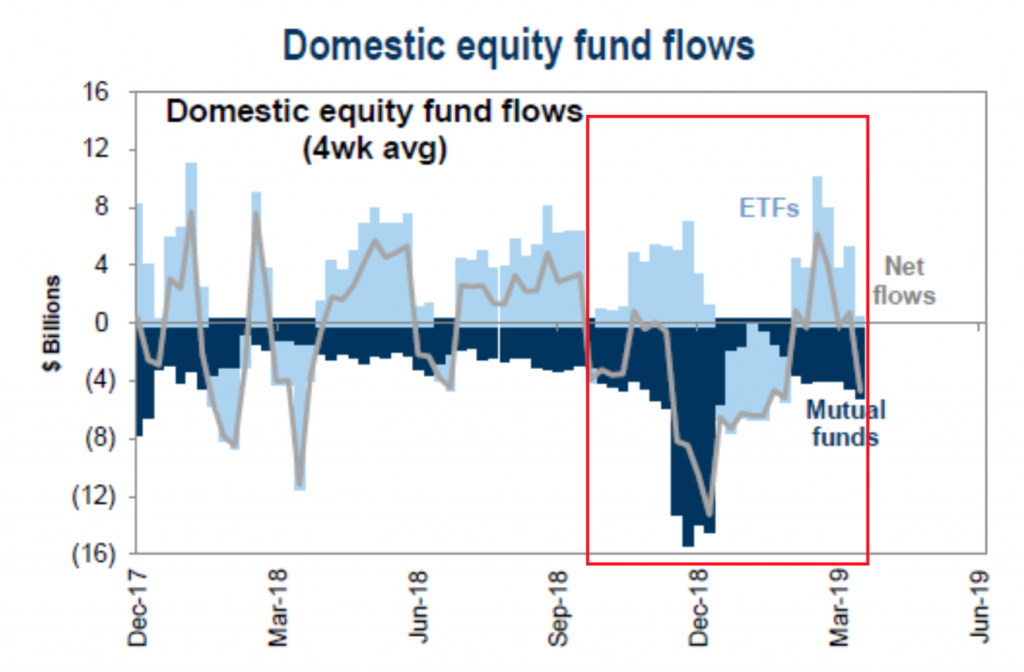
Source: Goldman Sachs Investment Research. Red box added by author.
As can be seen, just before the precipitous 4th quarter drop, net flows were positive over several months, as investors were loading up on billions worth of stock (equity) funds. And then after stock markets had already fallen quite a bit, investors pulled out on net billions from stock funds. However, just after taking billions out, the stock markets then had one of the strongest recoveries in some 20 years. In fact, investors did not return to the stock market on net until mid-March, after most of the recovery had happened.
So while the majority of stock markets recorded in our first chart had largely reached positive territory after the two quarters, what were the returns of the average investor? Those that were the marginal investor, exiting and entering, would have experienced almost the entire stock market drop and captured only a fraction of the recovery. In return terms, this average investor would have still been down about 8% versus those that stayed the course, who basically broken even. In other words, this average investor was investing in a roughly zero returning investment and yet earned an -8% return.
There is a more general takeaway from these past two quarters: Investors don’t often have the same return as their investments. In fact, historically, the average investor has had a much lower return than the investments she invests in. DALBAR, Inc. reports that over the 10 years through 2017, the average stock investor stock fund investor averaged a total return (roughly 61%) of just under half the return of the market they were investing in (roughly 123% total return).
The good news is that there are some time-tested ways to capture the full-market return, as well as some ways that can potentially garner returns for the investor even greater than the markets in which they invest. Strategic tax-harvesting and rebalancing across a States of the World® portfolio are just a couple of ways to potentially obtain this. Engineered indexing is yet another method. Fortunately, these are strategies we’ve been using for quite some time now together, and none of them require us to predict the future.
There is one aspect of the future that we can predict: it will be different. In some ways, the future is cyclical. Financial markets and fashion are two such examples. Can you believe after all these years of well-tailored pants, bell bottoms are coming back? Meanwhile, I’ve seen my suit lapels ebb and flow in width. And while many things are cyclical, it is very difficult to predict the amplitude and frequency of the cycles. Who would have thought the US would become a net exporter of oil for the first time in some 75 years?
Our motto at Omega Financial Group is to strategically prepare rather than predict. This means that I still have a couple suits with wide lapels, even though I’m still sporting the thin ones at the office. All the while, some companies, including Goldman Sachs, have significantly relaxed their dress code for the first time in history, which promises to further alter the business fashion cycle. As far as Omega, I can’t envision wearing flip flops to the office, but I could imagine a sport jacket and an ascot. I encourage you to have a look the next time you’re in the office. And maybe you can come wearing your best bell bottoms?
This commentary reflects the personal opinions, viewpoints and analyses of the Omega Financial Group, LLC employees providing such comments, and should not be regarded as a description of advisory services provided by Omega Financial Group, LLC or performance returns of any Omega Financial Group, LLC Investments client. The views reflected in the commentary are subject to change at any time without notice. Nothing in this commentary constitutes investment advice, performance data or any recommendation that any particular security, portfolio of securities, transaction or investment strategy is suitable for any specific person. Any mention of a particular security and related performance data is not a recommendation to buy or sell that security. Omega Financial Group, LLC manages its clients’ accounts using a variety of investment techniques and strategies, which are not necessarily discussed in the commentary. Investments in securities involve the risk of loss. Past performance is no guarantee of future results.