
4th Quarter 2018: What just happened?
“Take courage, my heart: you have been through worse than this.” Homer, Odyssey 20:18
What just happened this past quarter of 2018?
During the last quarter of 2018 many stock markets succumbed to the dreaded bear market, falling in value from their previous peak by at least 20%. Large US stocks experienced a roughly 19.5% drop, whereas the balance of US stocks handily exceeded losses of 20%. For the entire quarter, most international markets lost less money in dollar terms, especially emerging markets. For commodities, oil was one of the worst performing ones, falling close to 40% in value, whereas sugar was one of the best ones, growing almost 8% in value (I’m not sure what this all means, but I think it suggests you would have been happier eating ice cream over driving your car this past quarter).
One of the worst investments in the world was Bitcoin, falling another 42% in value over the past quarter. Cannabis stocks, the latest craze to supplant Bitcoin, were down close to the same amount, posting a loss of roughly 37% for the 4th quarter, according to the North American Marijuana Index. Meanwhile, there was some relief: most fixed income markets managed a small gain and some managed futures funds started extending gains through December. Across several measures, the quarter’s activity had not been matched since the 2008 financial crisis. After Christmas Eve turned in its worst day of market performance on record, financial markets mustered the beginning of a modest rebound before the close of the year, which has continued into January, 2019. In fact, from the low of Christmas Eve, some stock markets are up 10%.
Why did it happen?
The primary reason given for markets falling so precipitously is that investors have become increasingly concerned with the US economy entering a recession in 2019. The main argument for such a prognostication was the yield curve inverting. An inverted yield curve means bonds with longer maturities pay less income than bonds with shorter maturities. Some see this as predicting a recession, as historically there is an association between the two. In addition to an inverted yield curve, when the gap between typical corporate bond yields and government bond yields of the same maturity becomes too large, this also is said to be an indicator of a recession.
The Federal Reserve recently published research that showed there is indeed a correlation between these two bond factors and a recession. Further, one can combine the two for even greater prediction power. If using this combined model of the Federal Reserve, there is currently about a 50% chance we will be in a recession in the next twelve months. The following chart shows the predictive power of this model. The gray shaded regions are actual recessions and the blue line is the predicted probability from the Fed’s model.
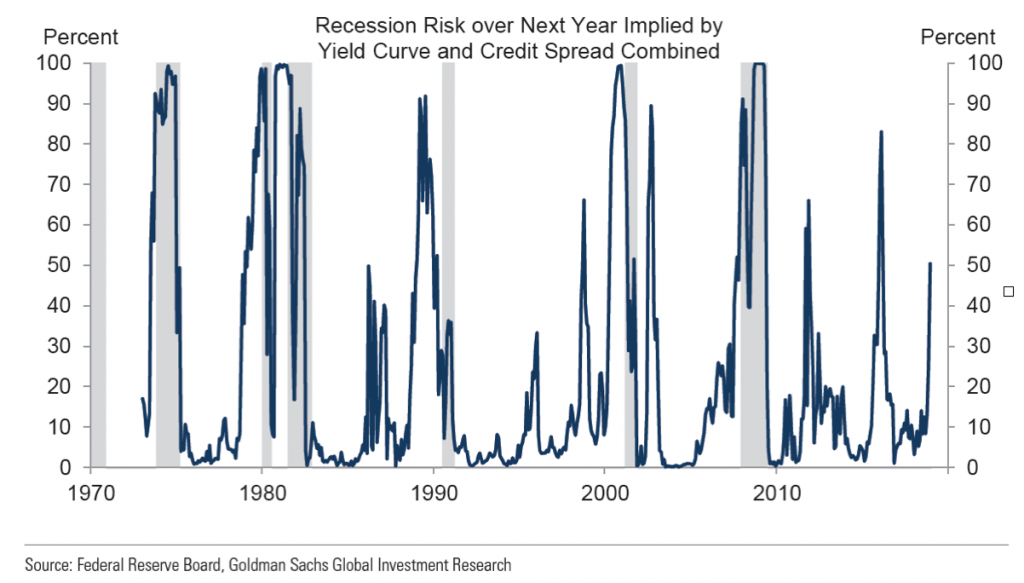
As the chart shows, the Fed’s model has predicted about 12 of the past 6 recessions. That is, it predicted a recession 12 times and 6 times the US actually entered in recession. This means when the model flashes red, it is essentially a coin toss or whether or not it is correct. In other words, this is still not that the great of a way to predict the economic future and it is questionable if spreads and curves can reliably help us decide when stocks will do well or poorly.
What will happen now?
The stock market is considered a leading economic indicator. That is, as the market goes up or down, it predicts the future gains or losses in the economy. Since stocks just fell dramatically, doesn’t this mean we are heading into a recession? Not necessarily.
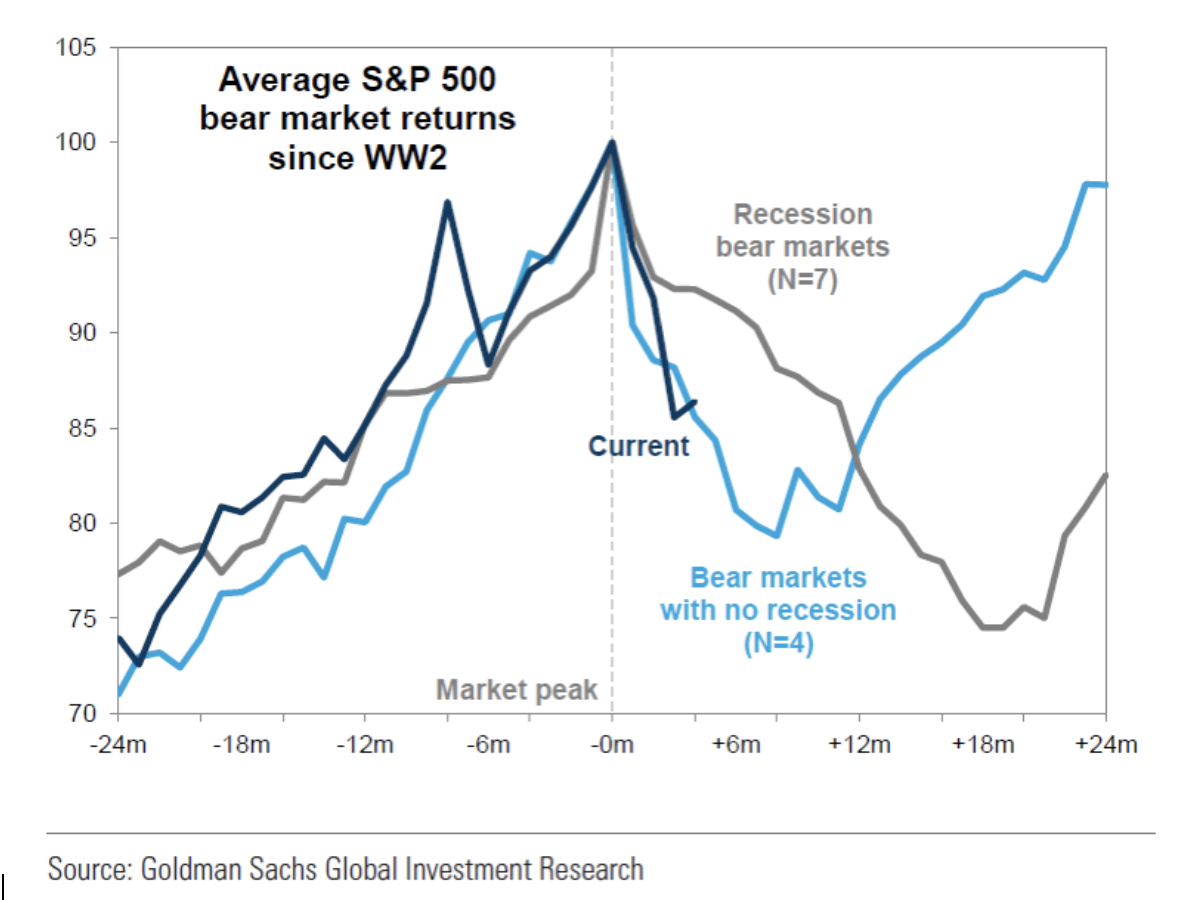
Since world war II, there have been eleven US stock bear markets. However, about 1/3 of such bear markets did not lead to a recession. The non-recession bear markets tend to be less severe and shorter, as the following chart illustrates:
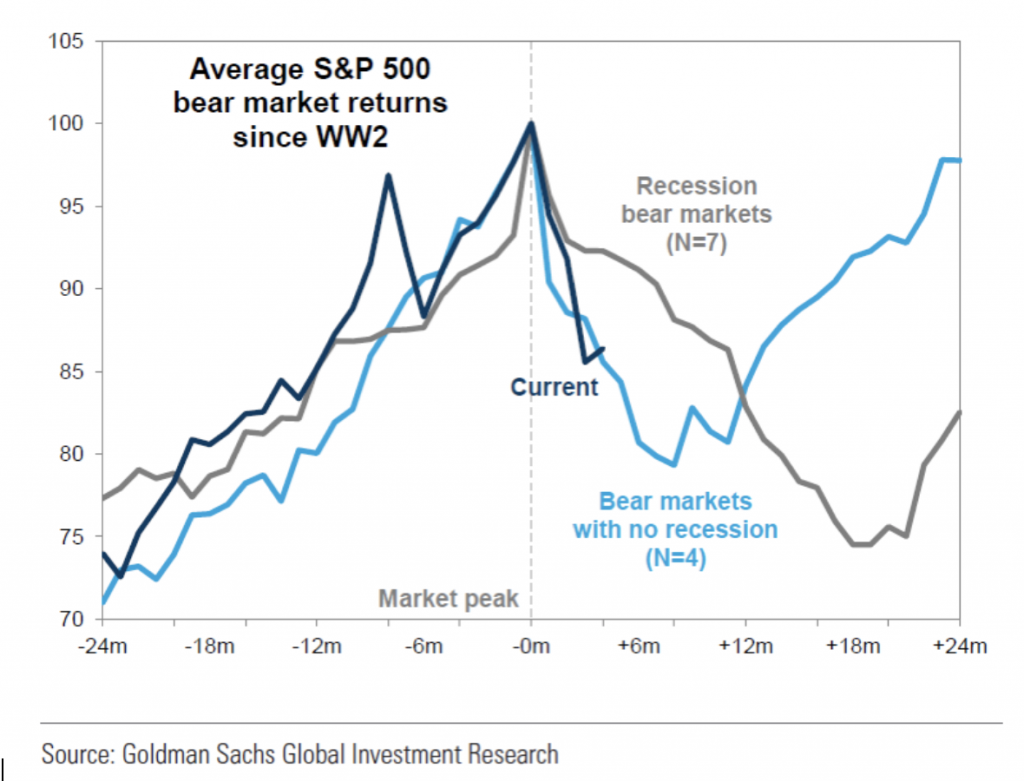
If we take averages literally, we might have a couple more months of market losses if this bear market does not lead to a recession.
There are two factors that do help identify when a recession is in the wings: economic growth slows to below an annual rate of 1% and unemployment rises sharply. The former is meaningful because an economy that essentially stops growing is in great danger of contracting, which is by definition a recession. The latter is meaningful because most of our economy is driven by consumers (about 2/3 of the US economy is comprised of personal consumption), and consumers with jobs tend to spend more money.
Currently, the US Current Activity Indicator, a measure of current economic activity is at about 2% and this usually falls to about .2% when a recession begins. In terms of unemployment, it tends to increase an average of .4% before a recession, which it has yet to do.
Of course, these measures are also not perfect.
What should we do now?
The first thing we need to do is accept that even with the biggest tools and brightest minds, it is difficult to reliably predict the economy and stock market returns. A consequence of this is to make sure that we construct portfolios that do not excessively rely on any one particular stock market or economic factor. For example, we want to make sure that your financial wellbeing does not depend on the 2019 Dow 30 stock market return or the level of GDP.
Instead, we suggest to focus on the robustness of your financial plan. If your plan is on solid ground, we do not need to worry about the year-to-year noise of financial markets and the economy and can instead stay the course.
Although the siren’s call rising from this noise to abandon ship can be awfully tempting, we suggest ignoring it and instead spend your time attached to more meaningful things, like enjoying family and friends. And reading a good book or attending great opera. In other words, it can be really helpful to focus on some other things. One translation of Homer says it this way: “Out of sight, out of mind.”
Our favorite suggestion of what else to do right now, instead of focusing on financial markets, is watching Australian Open tennis. Indeed, if any of you visit us in the near term, you just might find this playing on a couple of our TVs at the Omega office (though we promise we are still hard at work for you and your family!).
Meanwhile, thanks again for the opportunity to serve you and your family and we wish you a healthy, happy, and wealthy 2019.
This commentary reflects the personal opinions, viewpoints and analyses of the Omega Financial Group, LLC employees providing such comments, and should not be regarded as a description of advisory services provided by Omega Financial Group, LLC or performance returns of any Omega Financial Group, LLC Investments client. The views reflected in the commentary are subject to change at any time without notice. Nothing in this commentary constitutes investment advice, performance data or any recommendation that any particular security, portfolio of securities, transaction or investment strategy is suitable for any specific person. Any mention of a particular security and related performance data is not a recommendation to buy or sell that security. Omega Financial Group, LLC manages its clients’ accounts using a variety of investment techniques and strategies, which are not necessarily discussed in the commentary. Investments in securities involve the risk of loss. Past performance is no guarantee of future results.