
Supply Chains and Inflation: A Story of Thanksgiving
A nickel ain’t worth a dime anymore.
Yogi Berra
I’ve had a lot of worries in life, most of which never happened.
Mark Twain
Many clients have been asking about the problem of supply chains. Many other clients have been asking about the current high levels of inflation. It turns out, the two issues are quite connected.
For a motivating example, consider the price of turkey. For those of you celebrating Thanksgiving with turkey this year, you probably noticed prices have increased dramatically. In fact, turkey prices have been increasing some 20% per year since the COVID crisis. Meanwhile, wine (and other alcohol) has only been increasing around 3% per annum, a normal rate of inflation. An obvious solution is to drink more wine and give client gifts of wine over frozen turkey, both prescriptions that we’ve followed this year. But why the inflation difference between turkey and wine? Haven’t people been drinking more than ever since the pandemic? And maybe even eating less turkey? Thus, shouldn’t the price of wine be increasing more? The answer to this riddle is good old-fashioned supply and demand.
For some of us, “supply and demand” conjures fond memories of identifying equilibria of supply/demand models at university and beyond, whereas others have less fond memories of the topic. Whatever the case, it’s helpful to at least review a few basics so we can solve the turkey-wine inflation riddle.
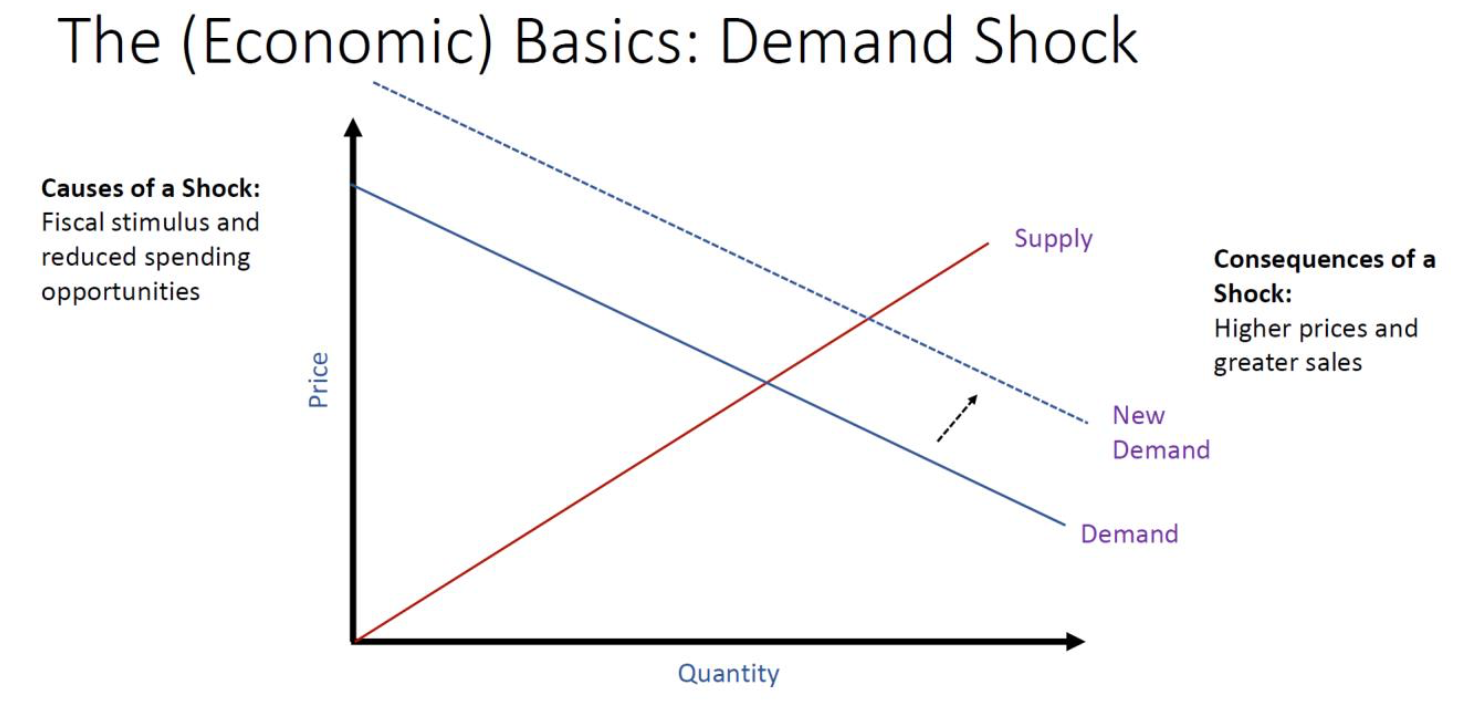
Below is a demand chart that also shows a “shock” to demand. A shock is when something happens that materially shifts consumers’ ability to buy goods. When a positive shock happens, consumers have a positive increase in money that they can use to buy things, which causes them to be willing to pay more for a given amount of goods and services. This creates a new demand line (the dotted blue line on the chart). This then creates a new equilibrium where more goods are sold and for higher prices, which means inflation. However, this is good inflation because it also means more things are being made and sold, which also means more employment.
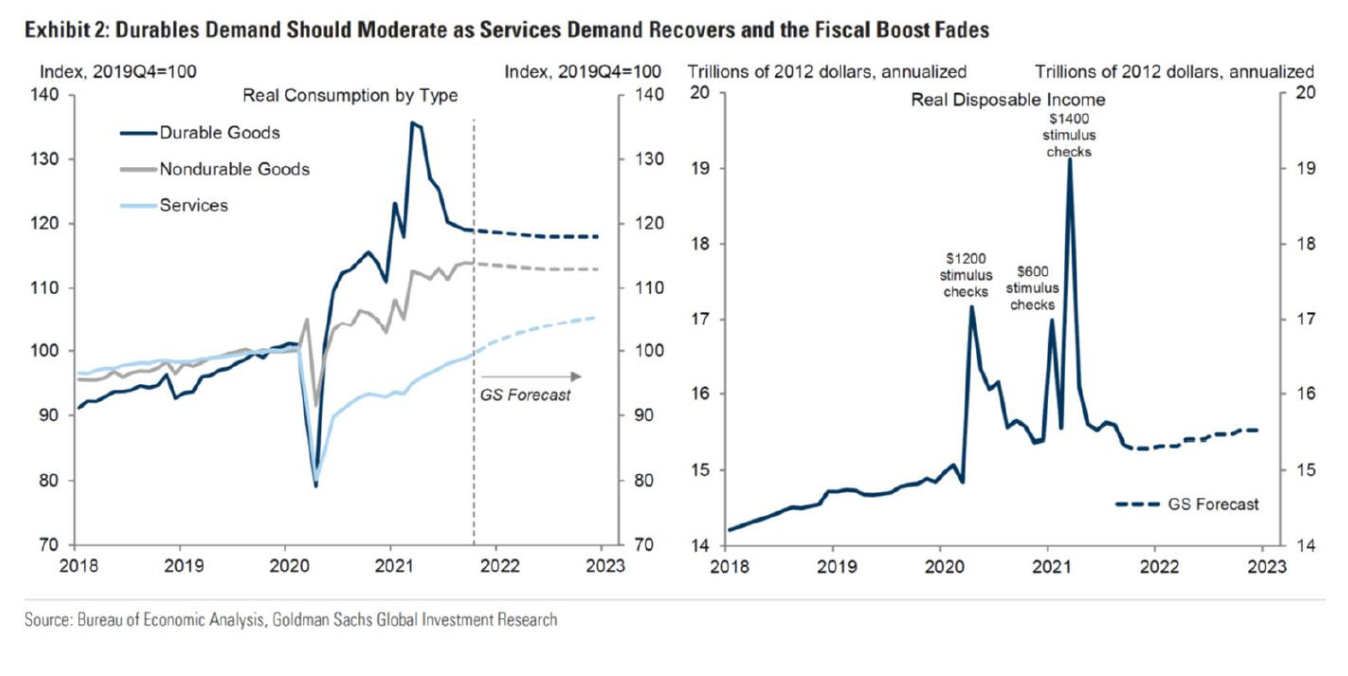
During the pandemic, trillions of stimulus dollars caused a positive demand shock, where, all of a sudden, many people had a lot of extra money to spend. Thus far, consumers spent this extra money mostly on durable goods like couches, washing machines, and automobiles. The below chart shows how the spikes in the availability of money via stimulus checks and the purchase of durable goods orders coincided. This was largely a US-only phenomenon, as the US had much greater stimulus than most countries.
As given above, this stimulus alone would create inflation. However, the problem was amplified when those goods being purchased also faced a supply shock. The below chart shows what a supply shock looks like. A supply shock happens when the cost of supplying a given amount of goods or services faces a sharp increase or decrease. For our current time, manufacturing disruptions from COVID, labor shortages sustained from workers receiving enhanced unemployment assistance, disruptions to inputs (e.g., semiconductors), and shipping congestion all conspired to create an adverse impact on the speed and cost of supply.

As can be seen, after a negative supply shock, the new state of the world includes higher prices, as with a positive demand shock from before. However, a negative supply shock also depresses output and associated employment.
In total, a positive demand shock and negative supply shock together unambiguously cause inflation through increased prices. However, the net production level effect from these two shocks is uncertain, as both forces pull in opposite directions.
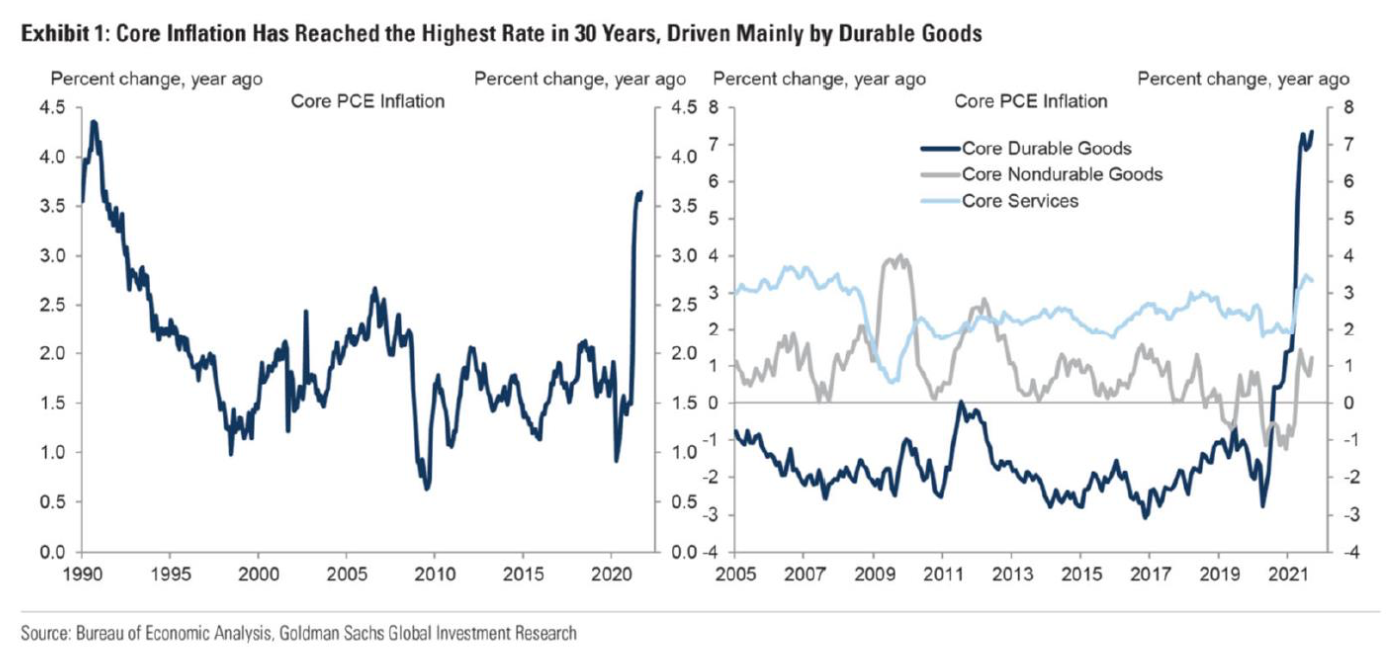
Another important feature of the pandemic, as mentioned above, is that extra demand has primarily been for durable goods (i.e., couches and cars etc.), which also experienced serious supply shocks. Consequently, when inflation is separated by durable goods and other goods and services, it becomes apparent that it is primarily only the former that has experienced material inflation. The chart below shows just this.
This then solves our inflation riddle from before: turkey has experienced supply shocks, whereas wine has generally not. Meatpackers, such as Tyson foods, were regularly in the press for plant shutdowns and reduced capacity due to their poor working conditions that made the industry especially susceptible to COVID-induced production slowdowns. Other durable good producers suffered plant shutdowns, both in the United States and abroad, due to COVID. In addition, oversea manufacturers then had to contend with delays from shipping congestion caused by skyrocketing demand for durable goods to build the stay-at-home lifestyle. Meanwhile, a lot of great wine was grown, processed, and shipped all from within the United States, even just within Santa Barbara County.
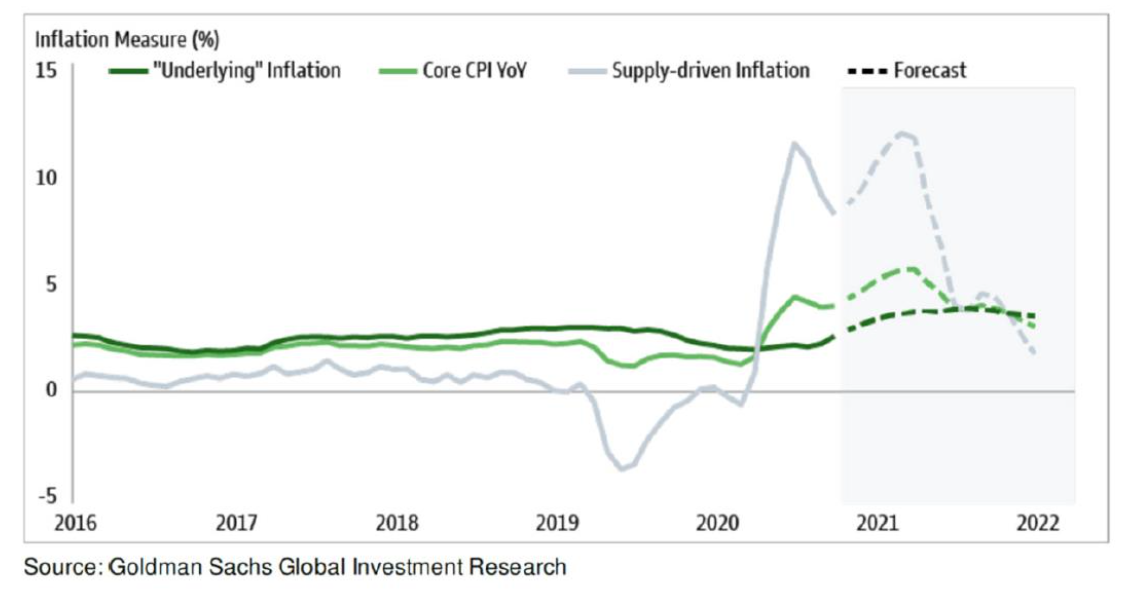
The good news is that both the demand and supply shock effects should prove temporary, in my view. Fiscal stimulus is largely over, and the Federal Reserve has finally reversed its “easy money” policy. Meanwhile, shipping congestion and COVID-induced plant closures are abating. As a result of these patterns, most economists are predicting that inflation and supply chains will be largely normalized by the end of next year (2022). This then means inflation should subside. The following chart from Goldman Sachs forecasts just this result.
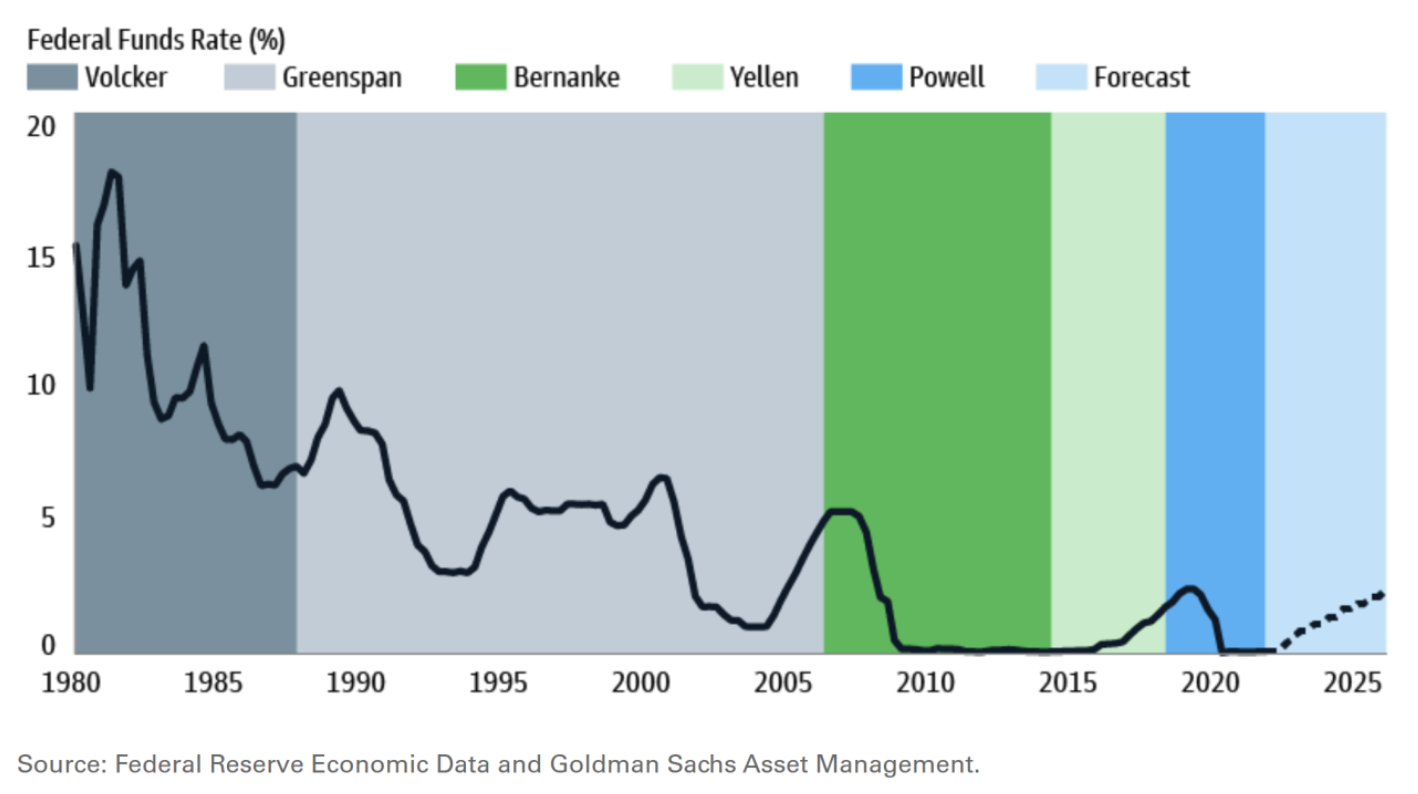
Even with moderating inflation, it is inevitable for interest rates to go up. Indeed, Powell recently announced an acceleration of the Fed’s asset purchases. This combined with expected rate hikes for 2022 all means rising rates and less “easy money.” These actions should help us get to a more normal economic environment. For context, here is what the Fed interest rate changes will likely look like, and how they will compare to recent history:
So what should we do over next 6-12 months as we wait for normalization with inflation, supply chains, and rates? I’m suggesting a simple set of actions I call L.E.S.S. is more. L stands for local. Buying local, especially when a local company is sourcing its inputs locally, tends to avoid many of the effects of supply disruptions. Of course, it is also always nice to support our local business ecosystem. E stand for experiences. Research shows that experiences tend to actually provide more happiness than things. Many experiences are free. And those that are not, are usually services. This brings us to our first S, which stands for services. Services are generally provided by local people and machines, and so they are not subject to the current supply disruptions. The final S is Social. It is an excellent time to support social causes. More than ever, nonprofits could use our support, as not all have fared so well through the pandemic.
To make this above prescription concrete, I will use myself as an example:
I am buying some wine and cheese from local vendors to enjoy on a great local hike with my wife. I’m also sneaking a local massage gift certificate into her stocking for post-hike soreness. Finally, I am supporting some of my favorite non-profits before year-end.
As we come to the end of our year, I hope we all look back on the year with gratitude, as we have much to be thankful for. In fact, a good part of the inflation problem is from healthy economic circumstances. And I hope we look forward to the New Year, to one that will be filled with health and prosperity. All of us at Omega wish you Happy Holidays, and we look forward to seeing you in the New Year!
Omega Financial Group, LLC is a Registered Investment Adviser. This commentary is solely for informational purposes. Advisory services are only offered to clients or prospective clients where Omega Financial Group, LLC and its representatives are properly licensed or exempt from licensure. Past performance is no guarantee of future returns. Investing involves risk and possible loss of principal capital. No advice may be rendered by Omega Financial Group, LLC unless a client service agreement is in place.